Message Passing Interface (MPI) Parallelism
Contents
Mango takes advantage of multi-core parallelism on both shared-memory and distributed-memory architectures through Message Passing Interface (MPI) algorithm implementations (see also Wikipedia Message Passing Interface).
mango.mpi module
The mango.mpi module contains functions and variables for handling various aspects related to MPI. Some useful functions include:
- mango.mpi.getLoggers() and mango.mpi.initialiseLoggers()
- Functions for generating and initialising logging.Logger objects which are configured to output MPI rank and message-time information when logging messages.
- mango.mpi.getCartShape()
- Returns a tuple indicating a cartesian grid of MPI processes.
- mango.mpi.rank and mango.mpi.size
- Convenience attributes for world communicator rank and world communicator size, respectively.
Executing python scripts in parallel
Typically MPI-parallel python is coded in a script file and is executed using the mpirun command. If the following script is written to the file example_mpirun_script.py:
#! /usr/bin/env python
import mango
import mango.mpi
import logging

logger,rootLogger = mango.mpi.getLoggers("example_mpirun_script")
mango.mpi.initialiseLoggers(
    ["example_mpirun_script",],
    logLevel=logging.INFO
)

logger.info("My rank is %2d in world of size %2d" % (mango.mpi.rank, mango.mpi.size))
rootLogger.info("Root rank is %2d" % (mango.mpi.rank,))

if (mango.mpi.rank == mango.mpi.size//2):
    logger.info("Extra logging from rank %2d" % (mango.mpi.rank,))
then it can be executed serially on a single process as:
mpirun -np 1 python example_mpirun_script.py
and the output is:
14:04:53:MpiRnk0:  My rank is  0 in world of size  1
14:04:53:MpiRoot0: Root rank is  0
14:04:53:MpiRnk0:  Extra logging from rank  0
Running on 2 MPI processes:
mpirun -np 2 python example_mpirun_script.py
generates output:
14:04:55:MpiRnk1:  My rank is  1 in world of size  2
14:04:55:MpiRnk1:  Extra logging from rank  1
14:04:55:MpiRnk0:  My rank is  0 in world of size  2
14:04:55:MpiRoot0: Root rank is  0
and, finally, running on 8 MPI processes:
mpirun -np 8 python example_mpirun_script.py
generates output:
14:04:57:MpiRnk6:  My rank is  6 in world of size  8
14:04:57:MpiRnk5:  My rank is  5 in world of size  8
14:04:57:MpiRnk3:  My rank is  3 in world of size  8
14:04:57:MpiRnk1:  My rank is  1 in world of size  8
14:04:57:MpiRnk0:  My rank is  0 in world of size  8
14:04:57:MpiRoot0: Root rank is  0
14:04:58:MpiRnk7:  My rank is  7 in world of size  8
14:04:58:MpiRnk4:  My rank is  4 in world of size  8
14:04:58:MpiRnk2:  My rank is  2 in world of size  8
14:04:58:MpiRnk4:  Extra logging from rank  4
Image domain decomposition
Mango image processing algorithms typically use data parallelism to achieve concurrency. By default, an image is decomposed into (approximately) equal sized disjoint rectangular sub-domains, with each sub-domain residing in the memory of a single MPI process. To illustrate, consider the following script (in file named domdecom.py) which simply creates a mango.Dds and assigns the elements (voxels) of the array to be the rank of the MPI process on which the elements are allocated:
#! /usr/bin/env python
import mango
import sys

mpidims=eval(sys.argv[1])
shape=[1,768,512]

dds = mango.zeros(shape=shape, mpidims=mpidims, dtype="uint8")
dds.asarray()[...] = dds.mpi.comm.Get_rank()
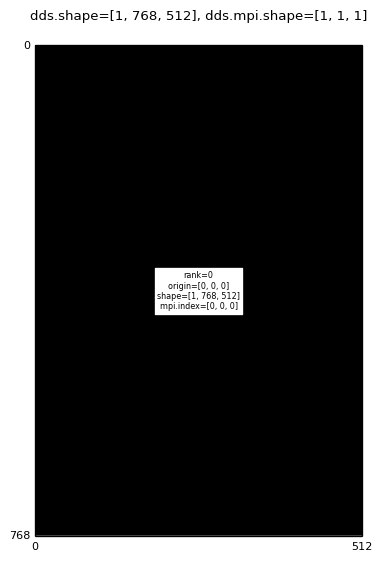
If this is executed on a single MPI process then all elements of the (1,768,512) shaped mango.Dds array are allocated on the single rank 0 MPI process. Of course, in this case the domain decomposition consists of one sub-domain which is identical to the global-domain.
Decomposition for: mpirun -np 1 domdecom.py 1,0,0
|
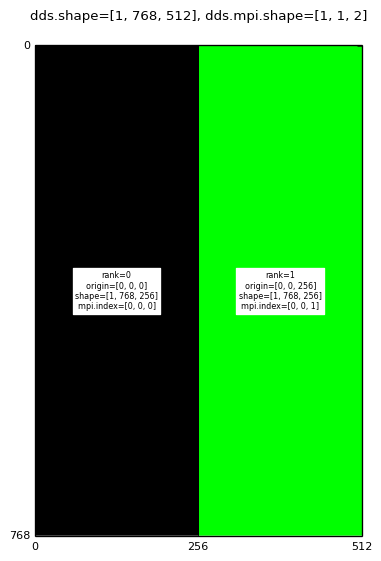
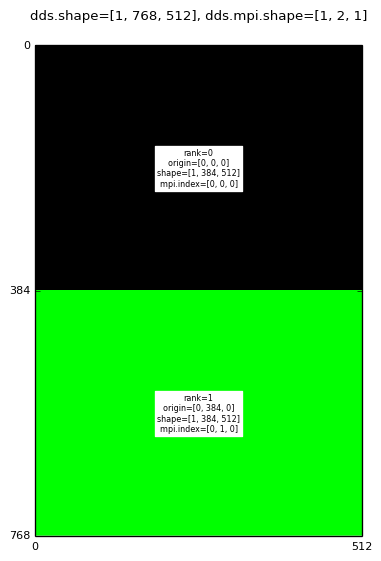
When executing on two MPI processes, disjoint half-domains are allocated on each of the MPI processes.
Decomposition for: mpirun -np 2 domdecom.py 1,0,0
|
Decomposition for: mpirun -np 2 domdecom.py 1,0,1
|
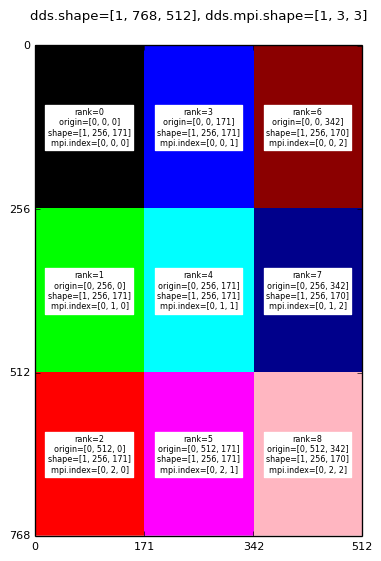
And for 9 MPI processes the decomposition is as follows:
Decomposition for: mpirun -np 9 domdecom.py 1,0,0
|
Decomposition for: mpirun -np 9 domdecom.py 1,0,1
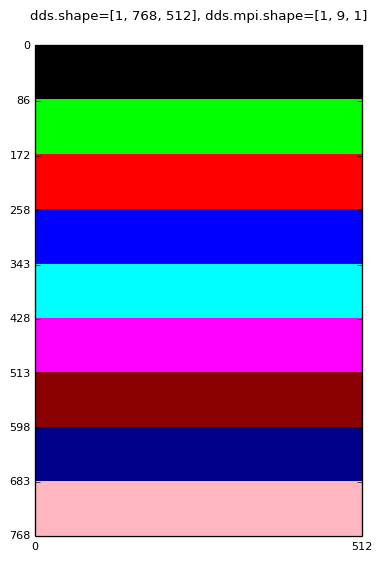
|
A mango.Dds object has three attributes associated with the MPI domain decomposition:
- Attribute mango.Dds.mpi
- A mango.DdsMpiInfo object which possesses attributes related to the MPI layout (mpidims), MPI communicator (mpi4py.MPI.Cartcomm) and the index of a MPI-process/sub-domain within the sub-domain grid.
- Attribute mango.Dds.subd
- A mango.DdsNonHaloSubDomain object with attributes related to the shape and position of the non-halo-sub-domain residing on a MPI process.
- Attribute mango.Dds.subd_h
- A mango.DdsHaloSubDomain object with attributes related to the shape and position of the halo-sub-domain residing on a MPI process.
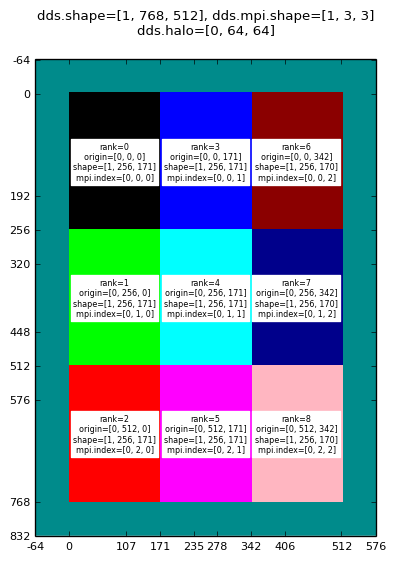
In the above images the text labels (black text on rectangular white background) are generated by converting the dds.subd.origin, dds.subd.shape, dds.subd.mpi.rank and dds.subd.mpi.index attributes to strings.
Sub-domains and halos
Often when processing the image sub-domain on one MPI process the computation requires data which has been allocated/assigned on a remote MPI process. For example, when computing the convolution of an image with a (3,3,3) shaped kernel, say, the convolution value at each voxel requires a (3,3,3) shaped neighbourhood of voxels from the original image. When the sub-domains are disjoint the border voxels of the sub-domain do not have complete neighbourhoods because some of the neighbourhood voxels reside on a different MPI process (or even outside the global image domain). Enter the halo voxels.
The halo is just a glorified term for an expansion of the MPI sub-domains, so that the sub-domains are no longer disjoint. When a mango.Dds object is created with a positive-sized halo, the sub-domain shape is enlarged by two times the halo-size, so each sub-domain has (halo-sized deep) border-layers of voxels which overlap with neighbouring sub-domains. Having the populated halo-voxels gives the neighbourhood voxels required to compute all convolution values on the disjoint (non-halo) sub-domains. The mango image processing routines are halo aware in that they compute image processing values for disjoint non-halo-sub-domain voxels but use/read the halo region voxels required to complete calculations.
The mango.Dds.subd attribute descibes the non-halo-sub-domain (exclusive sub-domain) and the mango.Dds.subd_h describes the halo-sub-domain (inclusive sub-domain), so that (using a single MPI process):
>>> import mango
>>> dds = mango.zeros(shape=(1,16,32), mtype="tomo", halo=(0, 4, 8), origin=(10,20,40))
>>> print(
...        (
...          "\n"
...          +
...          "(  dds.subd.origin,   dds.subd.shape) = (%s,%s)\n"
...          +
...          "(dds.subd_h.origin, dds.subd_h.shape) = (%s,%s)\n"
...        )
...        %
...        (dds.subd.origin, dds.subd.shape, dds.subd_h.origin, dds.subd_h.shape)
...    )

(  dds.subd.origin,   dds.subd.shape) = ([10 20 40],[ 1 16 32])
(dds.subd_h.origin, dds.subd_h.shape) = ([10 16 32],[ 1 24 48])

>>> print(dds.subd.origin == (dds.subd_h.origin - dds.subd_h.halo))
True
>>> print(dds.subd.shape == (dds.subd_h.shape - 2*dds.subd_h.halo))
True
The mango.Dds.subd and mango.Dds.subd_h objects each have asarray methods (mango.DdsNonHaloSubDomain.asarray() and mango.DdsHaloSubDomain.asarray(), respectively). The mango.DdsHaloSubDomain.asarray() returns a numpy.ndarray object which references the entire halo-sub-domain array (which is the same as the mango.Dds.asarray() method). The mango.DdsNonHaloSubDomain.asarray() method also returns numpy.ndarray object, however this object is a view of the halo-sub-domain array which is restricted to the non-halo-sub-domain region:
>>> import mango
>>> import numpy as np
>>> dds = mango.zeros(shape=(1,16,32), mtype="tomo", halo=(0, 4, 8), origin=(10,20,40))
>>> print(
...   "(dds.subd.asarray().shape, dds.subd_h.asarray().shape) = (%s,%s)"
...   %
...   (dds.subd.asarray().shape, dds.subd_h.asarray().shape)
... )
(dds.subd.asarray().shape, dds.subd_h.asarray().shape) = ([ 1 16 32],[ 1 24 48])
>>> print(dds.subd.asarray().shape == (dds.subd_h.asarray().shape - 2*dds.subd_h.halo))
True
>>> print(
...   "(dds.subd.asarray()[0,0,0], dds.subd_h.asarray()[tuple(dds.subd_h.halo)]) = (%s,%s)"
...   %
...   (dds.subd.asarray()[0,0,0], dds.subd_h.asarray()[tuple(dds.subd_h.halo))
... )
(dds.subd.asarray()[0,0,0], dds.subd_h.asarray()[tuple(dds.subd_h.halo)]) = (0, 0)
>>> dds.subd.asarray()[0,0,0] = 8
>>> print(
...   "(dds.subd.asarray()[0,0,0], dds.subd_h.asarray()[tuple(dds.subd_h.halo)]) = (%s,%s)"
...   %
...   (dds.subd.asarray()[0,0,0], dds.subd_h.asarray()[tuple(dds.subd_h.halo))
... )
(dds.subd.asarray()[0,0,0], dds.subd_h.asarray()[tuple(dds.subd_h.halo)]) = (8, 8)
>>> print("np.may_share_memory(dds.subd.asarray(), dds.subd_h.asarray())=%s" % (np.may_share_memory(dds.subd.asarray(), dds.subd_h.asarray()),))
np.may_share_memory(dds.subd.asarray(), dds.subd_h.asarray())=True
Image domain decomposition with halos
Now, returning to the domdecom.py script, we create a modified version (halodomdecom.py) which allows the specification of a halo value:
#! /usr/bin/env python
import mango
import sys

mpidims=eval(sys.argv[1])
if (len(sys.argv) > 2):
    halo = eval(sys.argv[2])
else:
    halo = 0

shape=[1,768,512]

dds = mango.zeros(shape=shape, mpidims=mpidims, dtype="uint8", halo=(0,halo,halo))
dds.subd_h.asarray()[...] = dds.mpi.comm.Get_rank()
dds.setBorderToValue(dds.mpi.comm.Get_size())
dds.updateHaloRegions()
A halo=(0,halo,halo) argument has been added to the mango.zeros() function call. Each halo-sub-domain array now has an increase in shape by (0,2*halo,2*halo) over the default halo=(0,0,0) halo-sub-domains created in the domdecom.py script. The assignment statement dds.subd_h.asarray()[...] = dds.mpi.comm.Get_rank() assigns all elements of the sub-domain array (even the halo voxels) to the rank of the corresponding MPI process. The call to the mango.Dds.updateHaloRegions() corrects the halo region values by fetching data from the appropriate remote MPI processes and assigning the correct sub-domain values to the halo voxels.
A side effect of the sub-domain expansion is that the global-domain also increases it’s shape by (0,2*halo,2*halo). Because the global halo regions lie outside the original domain, there is no information on how to assign values to these voxels. Typically they are either assigned a constant value or the image is mirrored into these global halo regions. In the halodomdecom.py script the global halo voxels are assigned to an invalid rank (one greater than the maximum valid rank) in the mango.Dds.setBorderToValue().
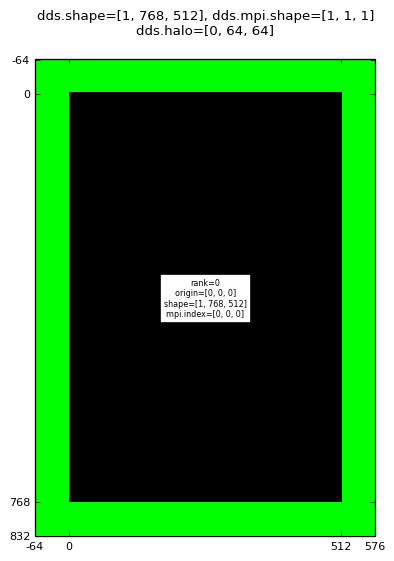
Executing the halodomdecom.py script with a halo of size 64 using a single MPI process gives a mango.Dds array where the central (1,768,512) shaped region is assigned to 0 and the outer 64-wide global halo region assigned to 1:
Decomposition with halo for: mpirun -np 1 halodomdecom.py 1,0,0 64
|
Note that the mango.Dds.shape, mango.Dds.origin, mango.DdsNonHaloSubDomain.shape and mango.DdsNonHaloSubDomain.origin do not account for the halo voxels, they refer to the non-halo region.
Running on 9 MPI processes:
Decomposition with halo for: mpirun -np 9 halodomdecom.py 1,0,0 64
|
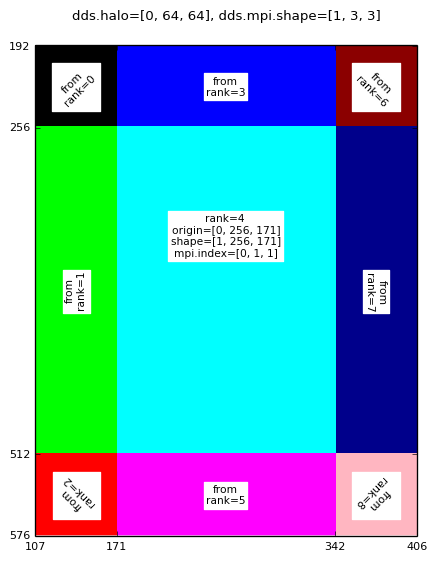
Rank 0 halo sub-domain for: mpirun -np 9 halodomdecom.py 1,0,0 64
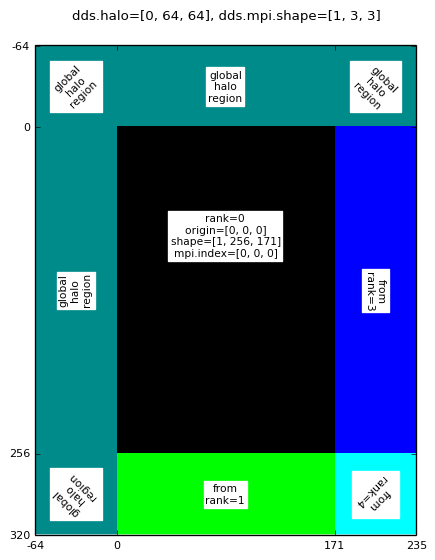
|
Rank 4 halo sub-domain for: mpirun -np 9 halodomdecom.py 1,0,0 64
|
Image Generating Script Source
For interest, we include the python source code which was used to generate the above domain decomposition images:
#! /usr/bin/env python
import matplotlib as mpl
from matplotlib import pyplot
import numpy as np
import scipy as sp
import mango
import mango.mpi
import mango.image
import sys
import logging

logger, rootLogger = mango.mpi.getLoggers("domain_decomp")

def createCMap():
    cmapColourList = \
        [
            "black",
            "#00ff00", # "Qt::green",
            "red",
            "blue",
            "cyan",
            "magenta",
            "darkred",
            "darkblue",
            "lightpink",
            "darkcyan",
            "#808000", #"darkyellow",
            "darkmagenta",
            "deeppink",
            "yellow",
            "lightblue",
            "darkgreen",
            "lightgrey",
            "darkgray",
            "beige",
            "cadetblue",
            "chocolate",
            "darkturquoise",
            "gainsboro",
            "hotpink",
            "khaki",
            "lightcoral",
            "maroon",
            "mintcream",
            "midnightblue",
            "olive",
            "palevioletred",
            "peachpuff"
        ]

    # make a color map of fixed colors
    cmap = mpl.colors.ListedColormap([cmapColourList[i % len(cmapColourList)] for i in range(0,256)])
    bounds=[i for i in range(0,257)]
    norm = mpl.colors.BoundaryNorm(bounds, cmap.N)

    return cmap, bounds, norm

def getTicks(subdList, origin, halo):
    labels = [[],[],[]]
    for subd in subdList:
        for axis in range(0,3):
            labels[axis].append(subd[1][axis] - subd[4][axis])
            labels[axis].append(subd[1][axis])
            labels[axis].append(subd[1][axis] + subd[2][axis])
            labels[axis].append(subd[1][axis] + subd[2][axis] + subd[4][axis])

    for axis in range(0,3):
        labels[axis] = list(set(labels[axis]))
        labels[axis].sort()
    ticks = [[],[],[]]
    for axis in range(0,3):
        for l in labels[axis]:
            ticks[axis].append(l - origin[axis] + halo[axis])
        labels[axis] = map(str,labels[axis])

    return ticks,labels

def getSubDomainTicks(dds):
    """
    Returns (ticks,labels) pair for use with :func:`matplotlib.pyplot.xticks`
    and :func:`matplotlib.pyplot.yticks`. Ticks denote the index values for
    exclusive and inclusive :samp:`dds.subd`.
    """
    subdList = \
            [(dds.mpi.comm.Get_rank(), dds.subd.origin, dds.subd.shape, dds.mpi.index, dds.subd.halo),]
    return getTicks(subdList, dds.subd.origin, dds.subd.halo)

def getDomainTicks(dds):
    """
    Returns (ticks,labels) pair for use with :func:`matplotlib.pyplot.xticks`
    and :func:`matplotlib.pyplot.yticks`. Ticks denote the index values for
    exclusive and inclusive subdomains.
    """
    subdList = \
        dds.mpi.comm.allgather(
            (dds.mpi.comm.Get_rank(), dds.subd.origin, dds.subd.shape, dds.mpi.index, dds.subd.halo)
        )
    return getTicks(subdList, dds.origin, dds.halo)

def plotDdsHaloDomainDecompSlice(
    dds,
    axis=0,
    index=0,
    doTextLabelDomains=False,
    doShow=False,
    fileName=None,
    dpi=128,
    subdRank=None
):
    # Get the number of MPI processes for the Dds communicator
    commSize = dds.mpi.comm.Get_size()

    if (subdRank == None):
        subdRank = commSize//2

    # Gather the details/extents of all MPI sub-domains
    subdList = dds.mpi.comm.allgather((dds.mpi.comm.Get_rank(), dds.subd.origin, dds.subd.shape, dds.mpi.index))

    ticks,labels = getSubDomainTicks(dds)

    if (dds.mpi.comm.Get_rank() == subdRank):

        # Get a 2D slice from the Dds.
        slcIdx = [slice(None), slice(None), slice(None)]
        slcIdx[axis] = slice(dds.halo[axis] + index, dds.halo[axis] + index + 1)
        slc = dds.asarray()[tuple(slcIdx)]
        slc = slc.reshape(tuple(slc.shape[1:]))

        # Create a discrete colour map for converting rank to colour.
        cmap, bounds, norm = createCMap()
        # tell imshow about color map so that only set colors are used
        img = \
            pyplot.imshow(
                slc,
                interpolation='nearest',
                aspect="equal",
                extent=None,
                cmap = cmap,
                norm=norm
            )
        # Add a title to the plot
        pyplot.title(
            "dds.halo=%s, dds.mpi.shape=%s" % (list(dds.halo), list(dds.mpi.shape)),
            fontsize="small",
            y=1.04
        )
        pyplot.xticks(ticks[2], labels[2], fontsize="x-small")
        pyplot.yticks(ticks[1], labels[1], fontsize="x-small")
        if (doTextLabelDomains):
            # Add text labels to the MPI subdomain regions.
            for r in range(subdRank, subdRank+1):
                subd = subdList[r]
                pyplot.text(
                    x = slc.shape[1]//2,
                    y = slc.shape[1]//2,
                    s = "rank=%s\norigin=%s\nshape=%s\nmpi.index=%s" % (subd[0], list(subd[1]), list(subd[2]), list(subd[3])),
                    fontsize=8,
                    color="black",
                    backgroundcolor="white",
                    horizontalalignment="center",
                    verticalalignment="center",
                    multialignment="center"
                )

            # label the halo regions
            halo = (dds.subd.halo[1], dds.subd.halo[2])
            posList = [
                (halo[1]//2, halo[0]//2, 45.),
                (slc.shape[1]//2, halo[0]//2, 0.0),
                (slc.shape[1]-halo[1]//2, halo[0]//2, -45.0),
                (halo[1]//2, slc.shape[0]-halo[0]//2, 135.),
                (slc.shape[1]//2, slc.shape[0]-halo[0]//2, 0.0),
                (slc.shape[1]-halo[1]//2, slc.shape[0]-halo[0]//2, -135.0),
                (halo[1]//2, slc.shape[0]//2, 90.0),
                (slc.shape[1]-halo[1]//2, slc.shape[0]//2, -90.0)
            ]
            for pos in posList:
                x = pos[0]
                y = pos[1]
                rotation = pos[2]
                if (slc[y,x] >= commSize):
                    s = "global\nhalo\nregion"
                else:
                    s = "from\nrank=%s" % (slc[y,x],)
                logger.info("(x,y)=(%s,%s), slc.shape=%s" % (x,y, slc.shape))
                pyplot.text(
                    x = x,
                    y = y,
                    s = s,
                    fontsize=8,
                    color="black",
                    backgroundcolor="white",
                    horizontalalignment="center",
                    verticalalignment="center",
                    multialignment="center",
                    rotation=rotation
                )

        pyplot.tight_layout()
        if (doShow):
            pyplot.show()
        if (fileName != None):
            # save to file.
            if (fileName == ""):
                haloStr = ""
                if (sp.any(dds.halo > 0)):
                    haloStr="Halo%s" % ("x".join(map(str,dds.subd.halo)),)
                fileName = \
                    (
                        "domainDecompImgSz%sMpiDims%sMpiIdx%s%s.png"
                        %
                        (
                            "x".join(map(str,dds.shape)),
                            "x".join(map(str,dds.mpi.shape)),
                            "x".join(map(str,dds.mpi.index)),
                            haloStr
                        )
                    )
            rootLogger.info("Saving domain decomposition image to file %s..." % fileName)
            pyplot.savefig(fileName, dpi=dpi, bbox_inches='tight', transparent="True")
            rootLogger.info("Done saving domain decomposition image to file %s." % fileName)

def plotDdsDomainDecompSlice(
    dds,
    axis=0,
    index=0,
    doTextLabelDomains=False,
    doShow=False,
    fileName=None,
    dpi=128,
    rootRank=0
):
    # Get the number of MPI processes for the Dds communicator
    commSize = dds.mpi.comm.Get_size()

    # Get a 2D slice from the Dds.
    slc = mango.image.gather_slice(dds, axis=0, index=dds.shape[0]//2, rank=rootRank)
    slc.setBorderToValue(commSize)

    # Gather the details/extents of all MPI sub-domains
    subdList = \
        dds.mpi.comm.allgather(
            (dds.mpi.comm.Get_rank(), dds.subd.origin, dds.subd.shape, dds.mpi.index, dds.subd.halo)
        )
    ticks,labels = getDomainTicks(dds)
    rootLogger.info(ticks)
    rootLogger.info(labels)
    if (dds.mpi.comm.Get_rank() == rootRank):
        # Create a discrete colour map for converting rank to colour.
        cmap, bounds, norm = createCMap()
        # tell imshow about color map so that only set colors are used
        img = \
            pyplot.imshow(
                slc.asarray().reshape(tuple(slc.asarray().shape[1:])),
                interpolation='nearest',
                aspect="equal",
                extent=None,
                cmap = cmap,
                norm=norm
            )
        # Add a title to the plot
        haloStr = ""
        if (sp.any(dds.halo > 0)):
            haloStr="\ndds.halo=%s" % (list(dds.halo),)

        pyplot.title(
            "dds.shape=%s, dds.mpi.shape=%s%s" % (list(dds.shape), list(dds.mpi.shape), haloStr),
            fontsize="small",
            y=1.04
        )
        pyplot.xticks(ticks[2], labels[2], fontsize="x-small")
        pyplot.yticks(ticks[1], labels[1], fontsize="x-small")
        if (doTextLabelDomains):
            # Add text labels to the MPI subdomain regions.
            for r in range(0, commSize):
                subd = subdList[r]
                pyplot.text(
                    x = subd[1][2] + subd[2][2]//2 + subd[4][2],
                    y = subd[1][1] + subd[2][1]//2 + subd[4][1],
                    s = "rank=%s\norigin=%s\nshape=%s\nmpi.index=%s" % (subd[0], list(subd[1]), list(subd[2]), list(subd[3])),
                    fontsize=6,
                    color="black",
                    backgroundcolor="white",
                    horizontalalignment="center",
                    verticalalignment="center",
                    multialignment="center"
                )
        pyplot.tight_layout()
        if (doShow):
            pyplot.show()
        if (fileName != None):
            # save to file.
            if (fileName == ""):
                haloStr = ""
                if (sp.any(dds.halo > 0)):
                    haloStr="Halo%s" % ("x".join(map(str,dds.halo)),)
                fileName = \
                    (
                        "domainDecompImgSz%sMpiDims%s%s.png"
                        %
                        (
                            "x".join(map(str,dds.shape)),
                            "x".join(map(str,dds.mpi.shape)),
                            haloStr
                        )
                     )
            rootLogger.info("Saving domain decomposition image to file %s" % fileName)
            pyplot.savefig(fileName, dpi=dpi, bbox_inches='tight', transparent="True")

if (__name__ == "__main__"):
    mango.mpi.initialiseLoggers(["domain_decomp",], logLevel=logging.INFO)

    imgShape = eval(sys.argv[1])
    mpidims = eval(sys.argv[2])
    doTextLabelDomains = False
    if (len(sys.argv) > 3):
        doTextLabelDomains = eval(sys.argv[3])

    halo=None
    if (len(sys.argv) > 4):
        halo = eval(sys.argv[4])

    if (halo == None):
        halo = 0

    dds = mango.zeros(shape=imgShape, mpidims=mpidims, dtype="uint8", halo=(0,halo,halo))
    dds.asarray()[...] = dds.mpi.comm.Get_rank()
    dds.updateHaloRegions()
    dds.setBorderToValue(dds.mpi.comm.Get_size())

    dpi = 96
    plotDdsDomainDecompSlice(
        dds,
        axis=0,
        index=0,
        doTextLabelDomains=doTextLabelDomains,
        doShow=False,
        fileName="",
        dpi=dpi
    )
    pyplot.clf()
    if (halo > 0):
        rootLogger.info("Plotting halo subdomain...")
        subdRank = dds.mpi.comm.Get_size()//2
        rootLogger.info("Plotting halo domain decomposition for rank %s" % subdRank)
        plotDdsHaloDomainDecompSlice(
            dds,
            axis=0,
            index=0,
            doTextLabelDomains=doTextLabelDomains,
            doShow=False,
            fileName="",
            dpi=dpi,
            subdRank = subdRank
        )
        rootLogger.info("Done plotting halo domain decomposition for rank %s." % subdRank)
        if (subdRank != 0):
            pyplot.clf()
            subdRank = 0
            rootLogger.info("Plotting halo domain decomposition for rank %s" % subdRank)
            plotDdsHaloDomainDecompSlice(
                dds,
                axis=0,
                index=0,
                doTextLabelDomains=doTextLabelDomains,
                doShow=False,
                fileName="",
                dpi=dpi,
                subdRank = subdRank
            )
            rootLogger.info("Done plotting halo domain decomposition for rank %s." % subdRank)
and the shell script for generating all images:
#!/usr/bin/env bash
export IMG_SHAPE="1,768,512"
mpirun -np 1 ../gen_domain_decomp_images.py ${IMG_SHAPE} 1,0,0 True
mpirun -np 2 ../gen_domain_decomp_images.py ${IMG_SHAPE} 1,0,0 True
mpirun -np 2 ../gen_domain_decomp_images.py ${IMG_SHAPE} 1,0,1 True
mpirun -np 9 ../gen_domain_decomp_images.py ${IMG_SHAPE} 1,0,0 True
mpirun -np 9 ../gen_domain_decomp_images.py ${IMG_SHAPE} 1,0,1 False
mpirun -np 1 ../gen_domain_decomp_images.py ${IMG_SHAPE} 1,0,0 True 64
mpirun -np 9 ../gen_domain_decomp_images.py ${IMG_SHAPE} 1,0,0 True 64